Service Dependency Graph
The Service Dependency Graph is an interactive node-graph visualization of your PagerDuty service topology — business services, technical services, and the dependency relationships between them — rendered directly inside your agent chat session. Built on the MCP Apps extension, it lets you see at a glance which services are affected by active incidents and how they relate to each other.
What you see
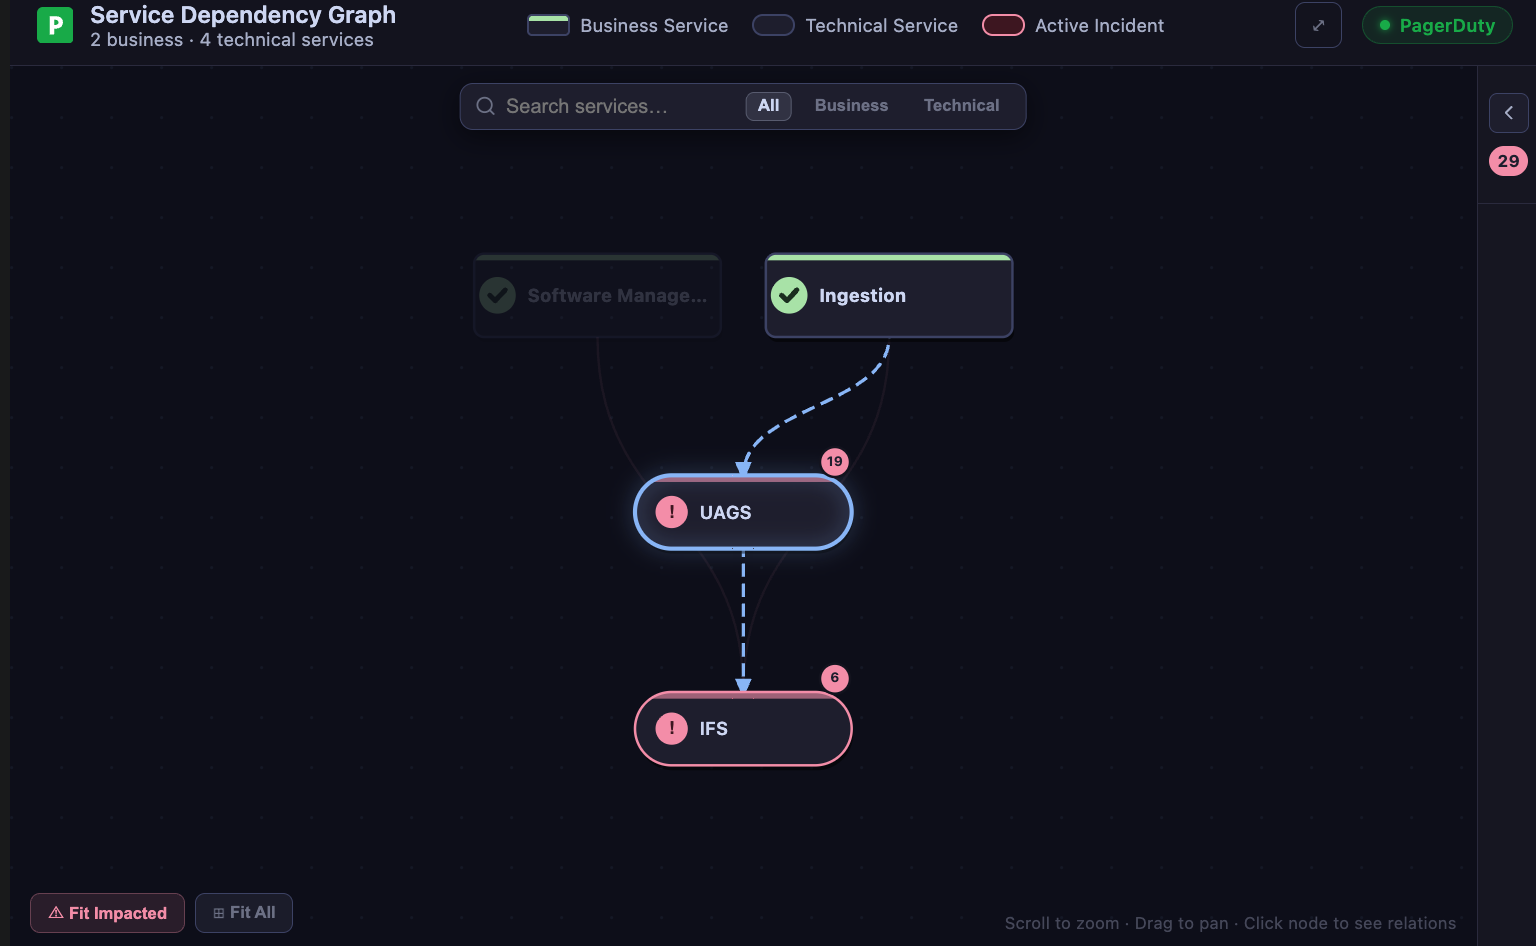
The graph opens in a dark canvas with two types of nodes:
- Business services — rendered as rounded rectangles with a distinct accent border
- Technical services — rendered as circles
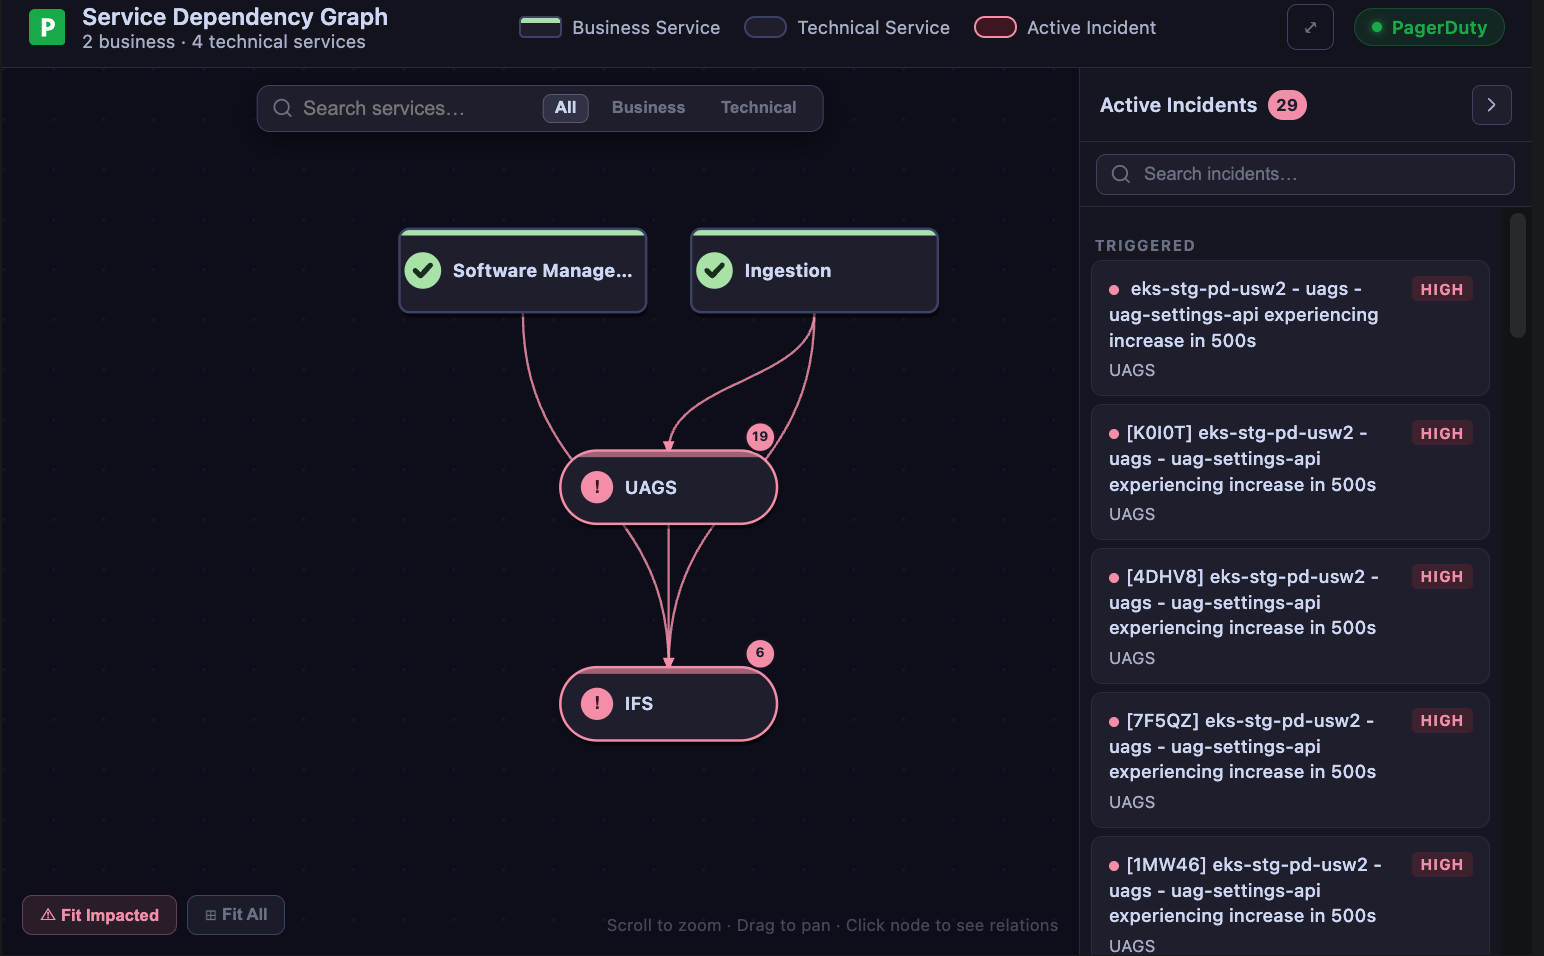
Edges between nodes represent dependency relationships. Services with active incidents are highlighted in red so problem areas stand out immediately.
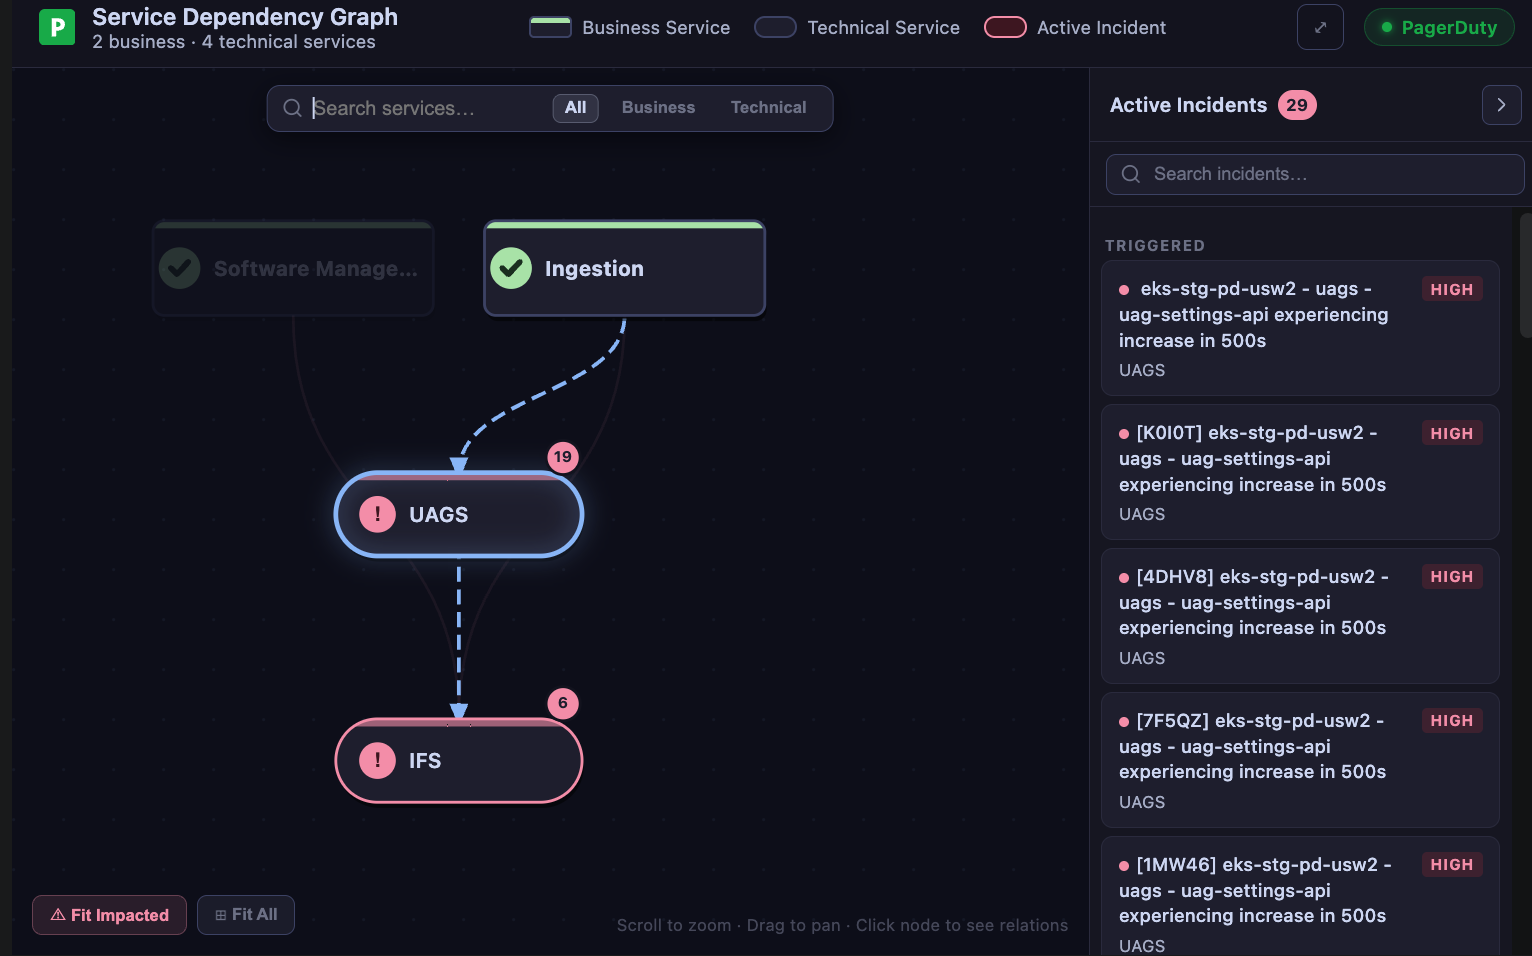
A collapsible Active Incidents sidebar on the right lists all triggered and acknowledged incidents. Each entry shows the incident title, status badge, urgency, and the affected service.
What you can do
Explore the topology
Pan and zoom across the canvas to explore large service graphs. The layout positions services to minimize edge crossings, making dependency chains easier to follow.
Spot impact at a glance
Services with active incidents are highlighted in red on the canvas. The sidebar groups incidents by status — triggered incidents appear first, acknowledged below — so you can quickly prioritize.
Search incidents
Use the search box in the sidebar to filter incidents by title or service name. Useful when you have many active incidents and need to find a specific one fast.
Collapse the sidebar
Click the toggle to collapse the incident sidebar and give the graph more screen space. The incident count badge remains visible even when the panel is collapsed.
Click an incident
Click any incident in the sidebar to jump to its context — the graph highlights the affected service node so you can see its dependencies immediately.
How it works
The Service Dependency Graph calls list_services, list_business_services (via business_services tools), and list_incidents through the PagerDuty MCP Server. Dependency relationships are fetched from the PagerDuty service dependency API. Everything is rendered client-side on an HTML canvas — no external graph library required.
Supported clients
| Client | Status |
|---|---|
| VS Code (GitHub Copilot) | Supported |
| Claude Desktop | Supported |
| Goose | Supported |
Try it out
The Service Dependency Graph is available on the experimental branch:
uvx --from git+https://github.com/PagerDuty/pagerduty-mcp-server@experimental pagerduty-mcp
Or clone and run locally:
git clone -b experimental https://github.com/PagerDuty/pagerduty-mcp-server.git
cd pagerduty-mcp-server
uv run python -m pagerduty_mcp
Then ask your agent:
Show me the service dependency graph
The Service Dependency Graph is experimental. It may change or break between commits and is not covered by the standard support policy. Run it in non-production environments.
Feedback
Found a bug or have ideas for the graph layout? Open a GitHub issue tagged experimental: