Incident Command Center
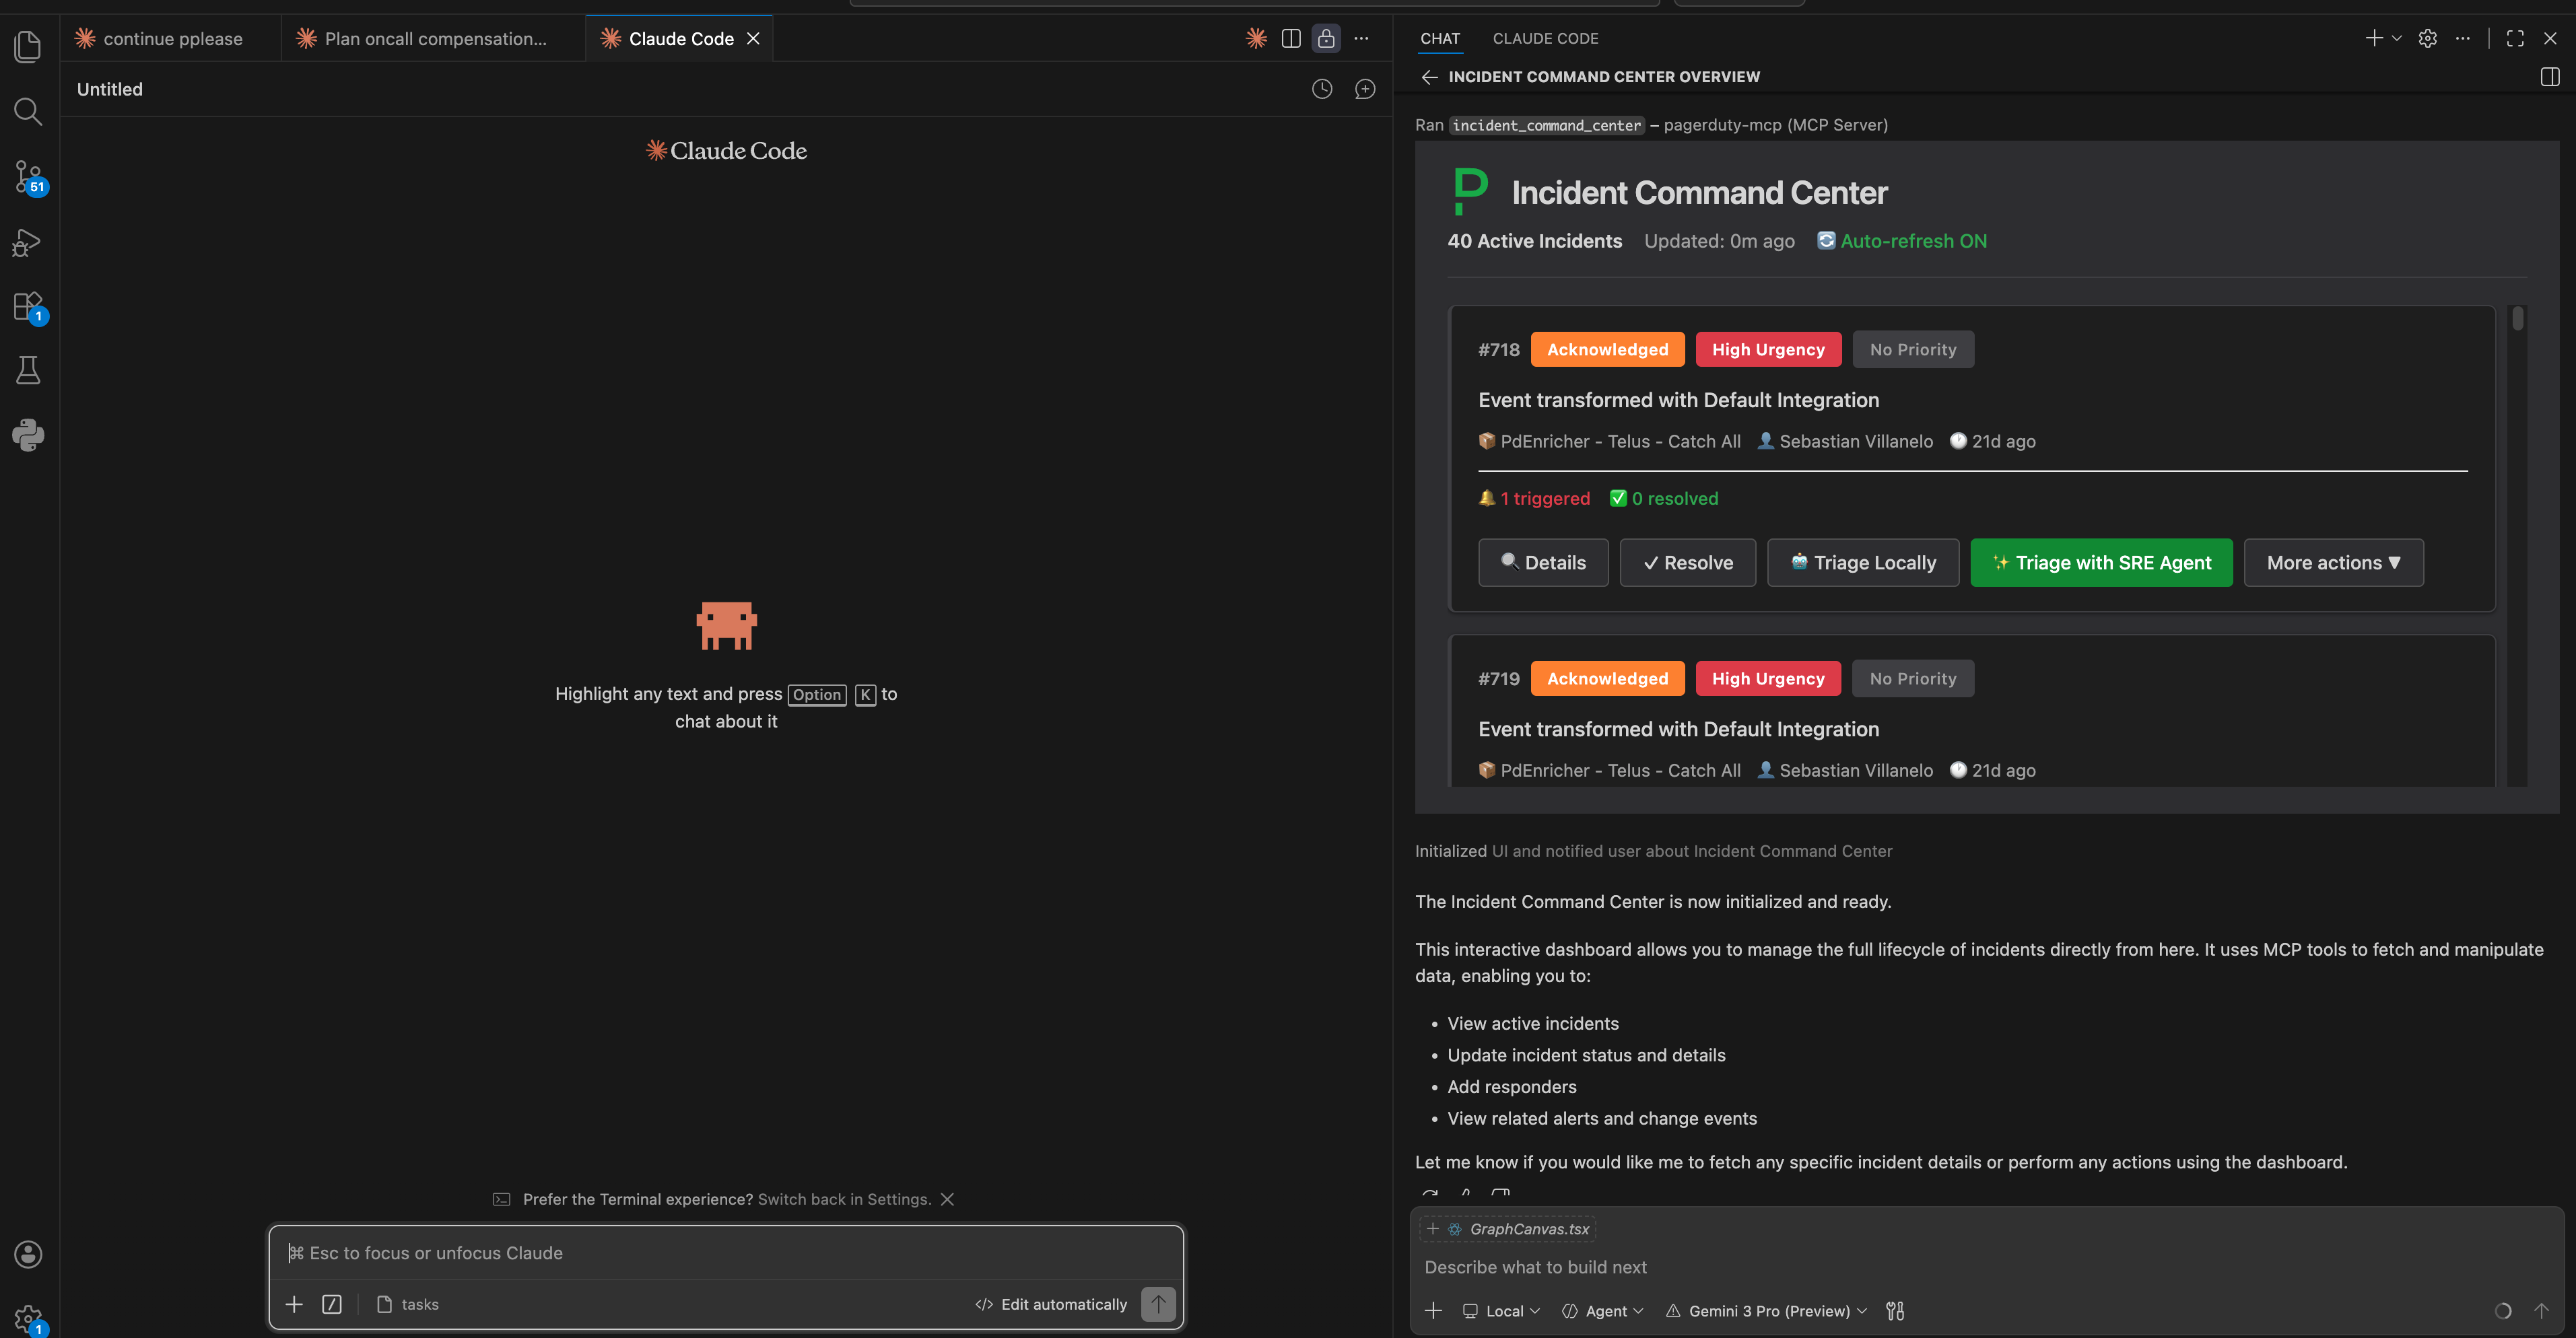
The Incident Command Center is an interactive incident management dashboard that renders directly inside your agent chat session. Built on the MCP Apps extension, it lets you view, triage, and act on PagerDuty incidents without leaving your IDE or desktop client.
No tab-switching. No context loss. The full incident workflow — from detection to resolution — lives in your chat.
What you see
When the Incident Command Center opens, you get a live dashboard of your active incidents.
Each incident card shows:
- Title and incident number
- Status badge — Triggered, Acknowledged, or Resolved
- Urgency badge — High or Low
- Priority badge — P1 through P5
- Affected service
- Assignee
- Alert count
The dashboard polls the PagerDuty MCP Server automatically, so the list stays current as incidents are created, acknowledged, or resolved.
What you can do
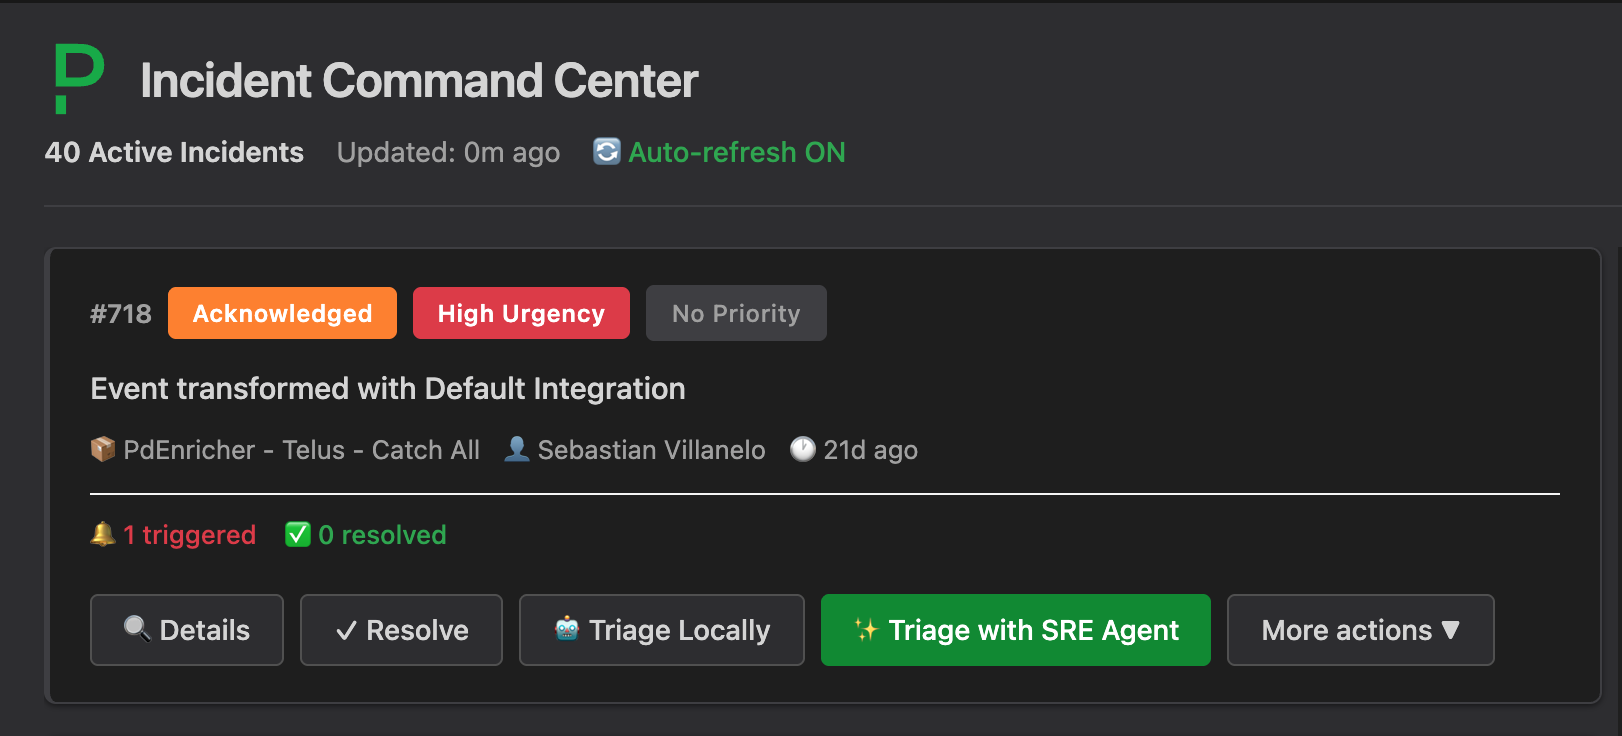
Each incident card has action buttons for the most common operations:
| Button | Action |
|---|---|
| Details | Open the full incident detail view |
| Resolve | Resolve the incident immediately |
| Triage Locally | Run a local AI-assisted triage workflow |
| Triage with SRE Agent | Hand off to a remote SRE agent for deeper investigation |
| More actions | Expand the action menu for additional options |
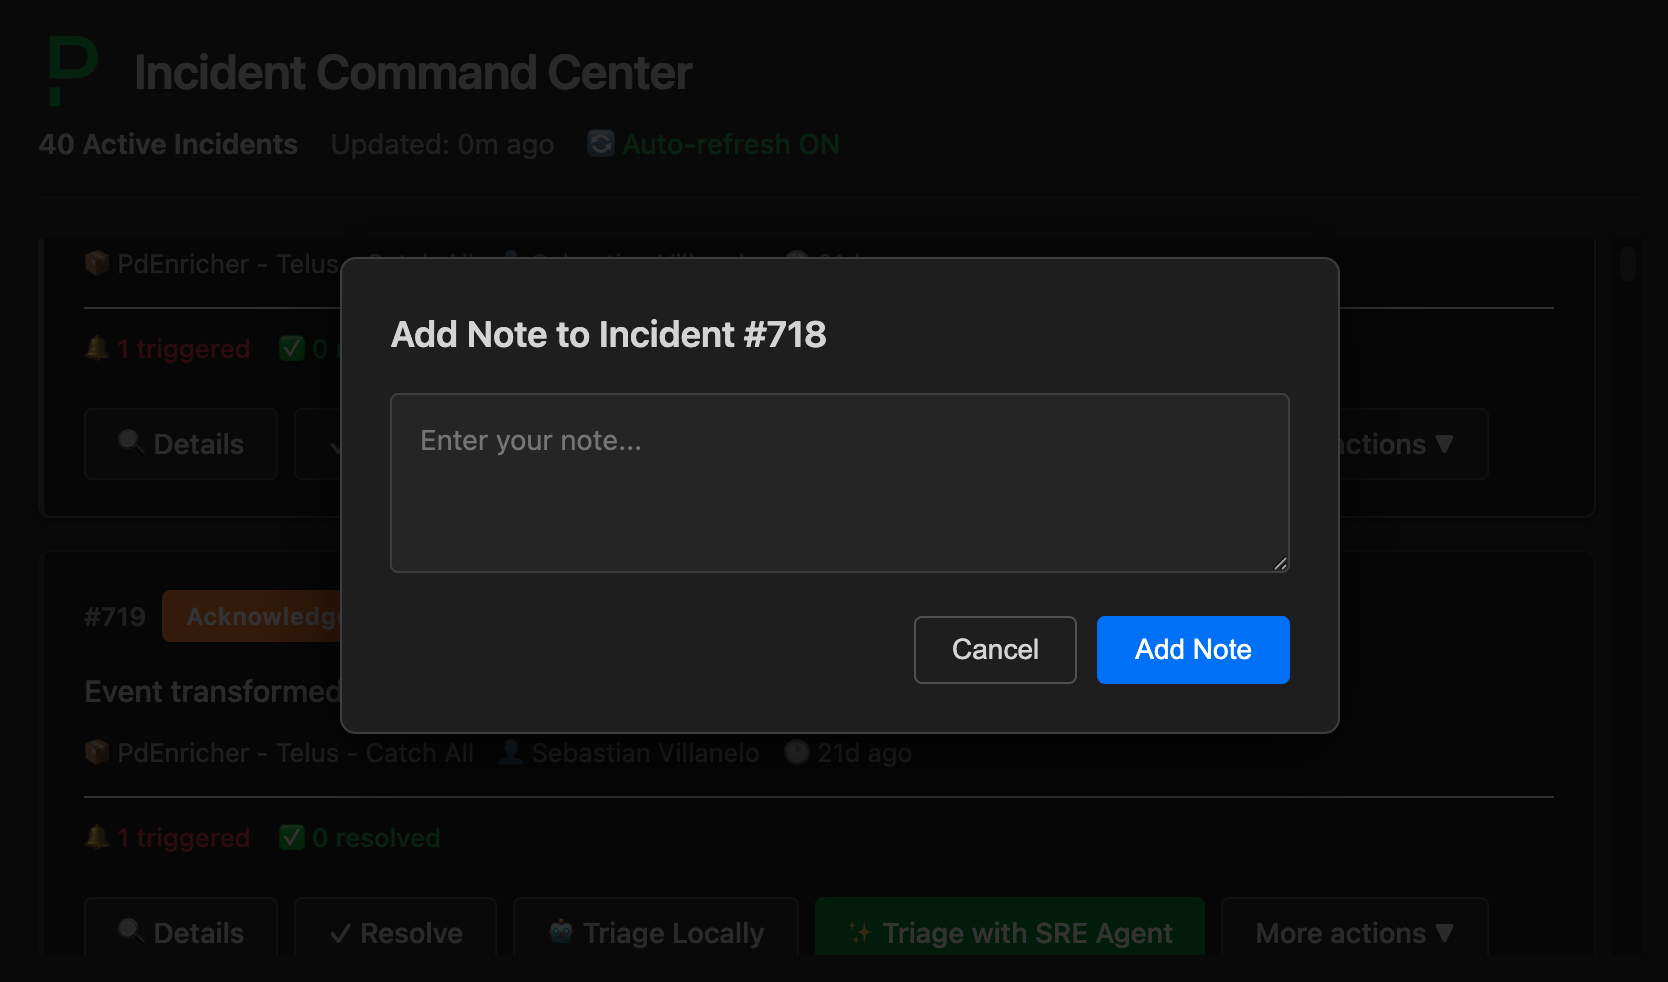
Add Note
Attach a note to an incident without opening PagerDuty in a browser. The modal lets you type free-form text and submit it directly.
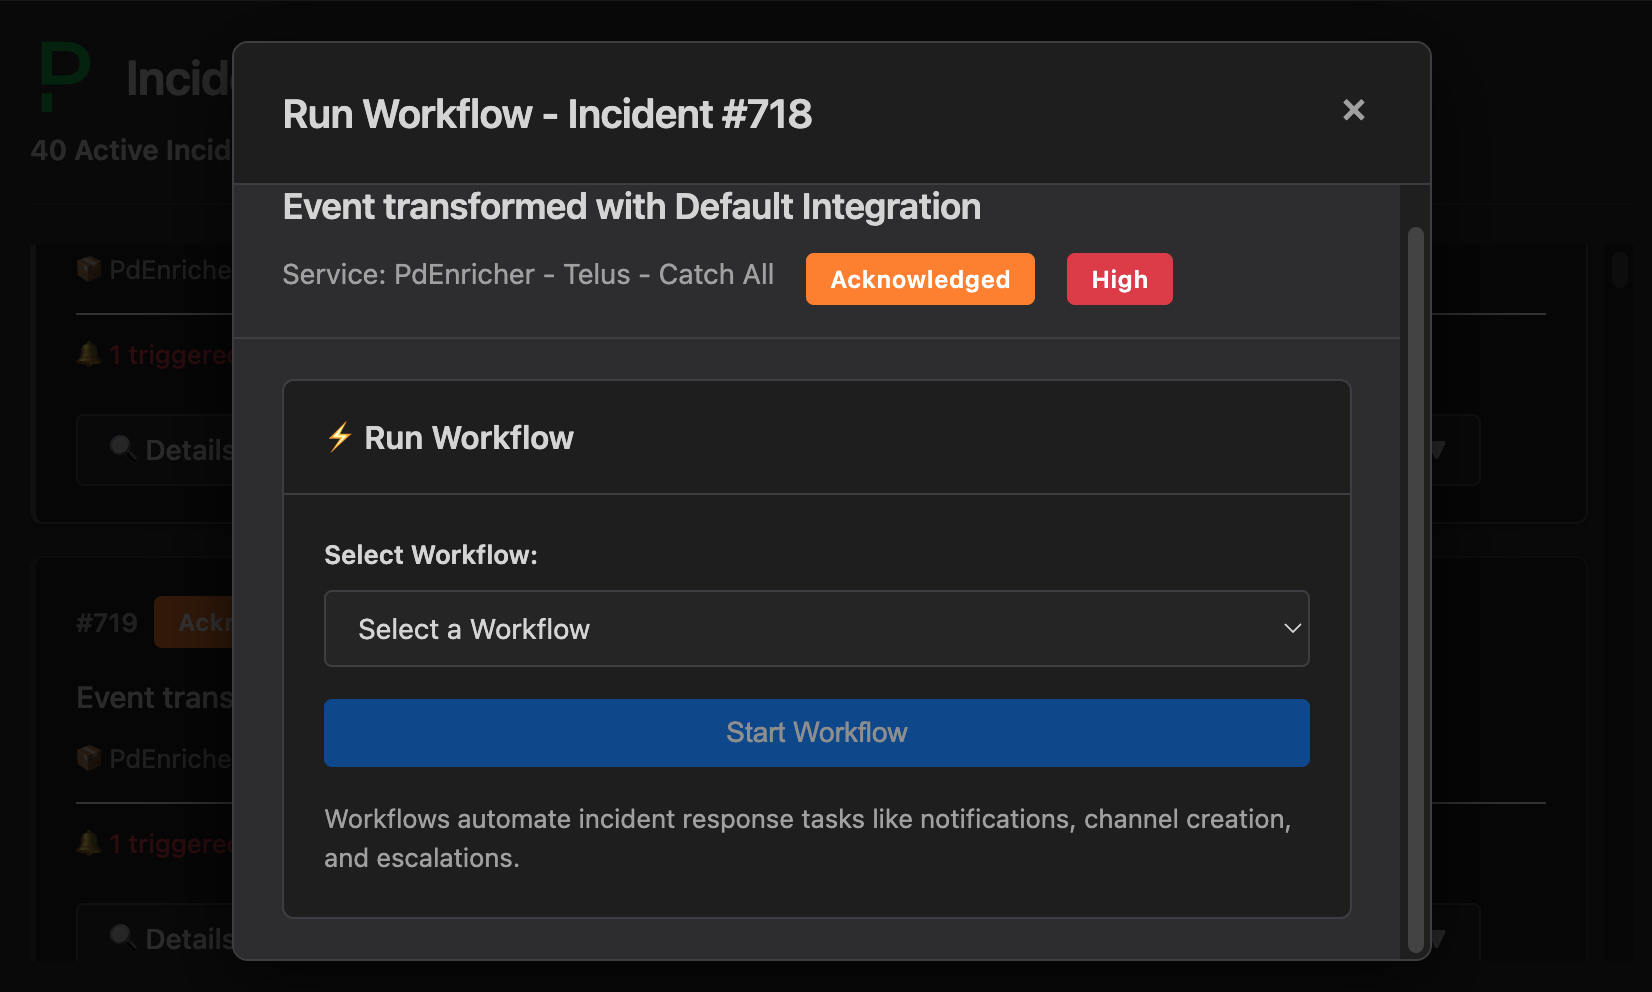
Run Workflow
Trigger a PagerDuty workflow from the dashboard. Select the workflow you want to run from the list and confirm — no need to navigate to the PagerDuty web UI.
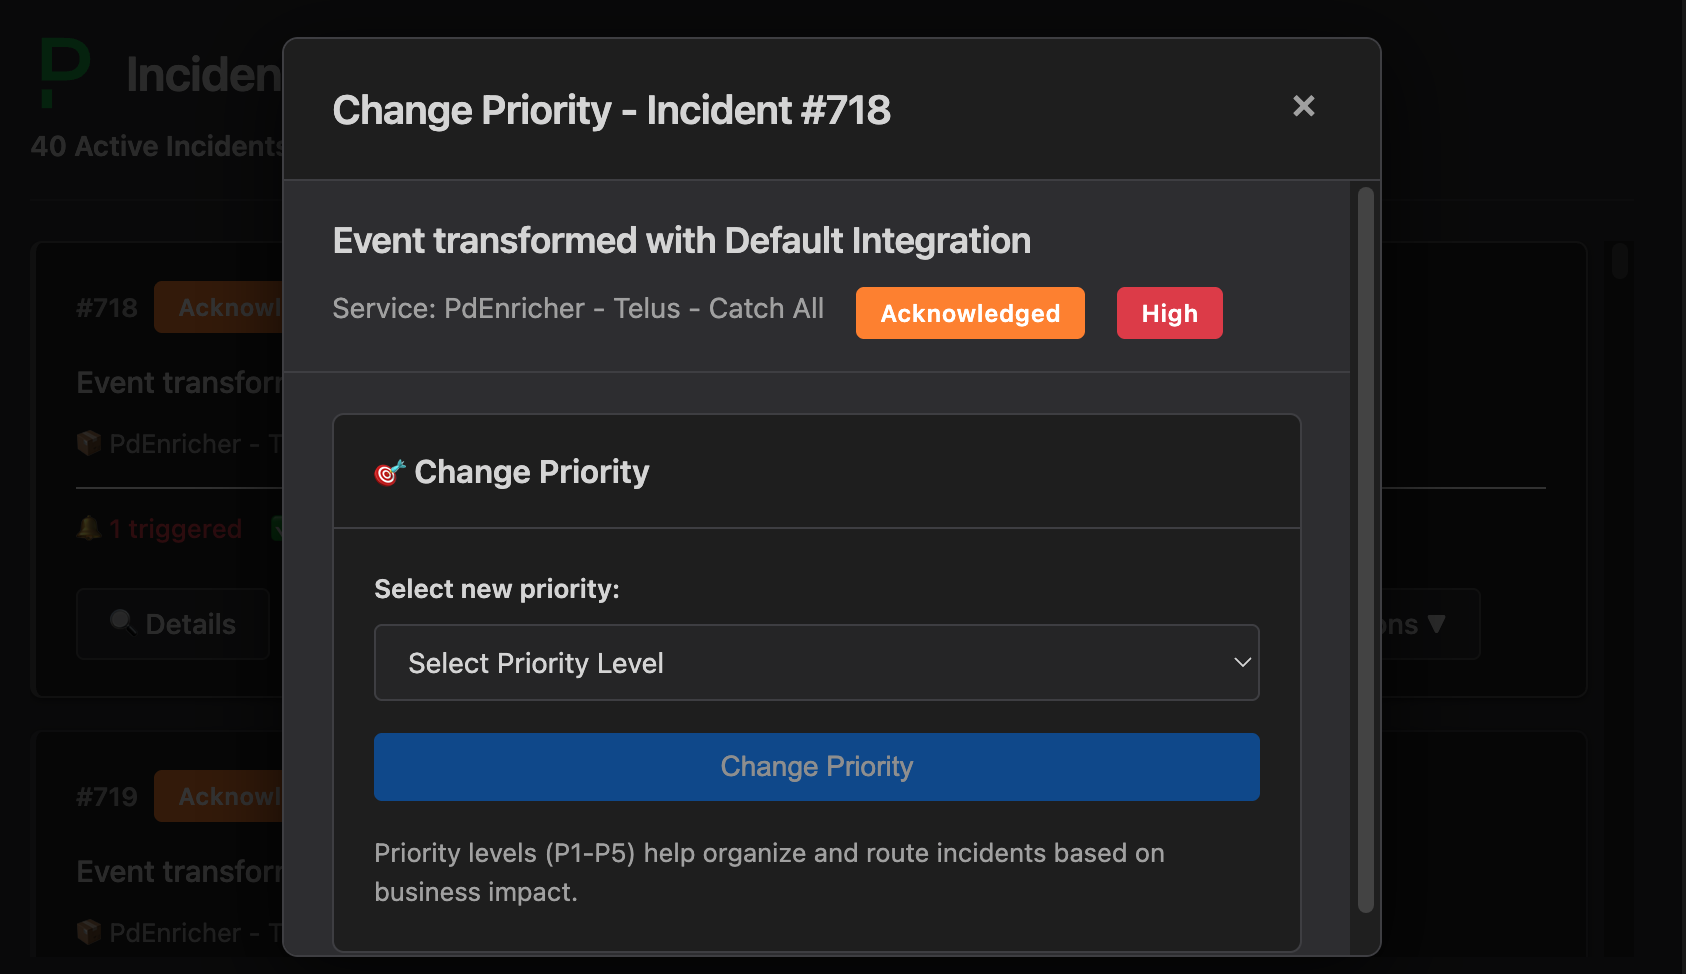
Change Priority
Update an incident's priority inline. Select P1–P5 from the modal and apply the change in one click.
How it works
The Incident Command Center is composed of three layers:
-
MCP Apps runtime — The client (VS Code, Claude Desktop, etc.) renders a sandboxed iframe using the MCP Apps extension. The app communicates bidirectionally with the MCP server through the MCP protocol.
-
PagerDuty MCP Server tools — Read actions (listing incidents, fetching details) use the standard read tools. Write actions (resolve, add note, run workflow, change priority) require the server to be started with
--enable-write-tools. -
Auto-refresh — The dashboard polls the server on a short interval so incident state stays current without manual refresh.
Supported clients
The Incident Command Center works in any MCP client that supports the MCP Apps extension:
| Client | Status |
|---|---|
| VS Code (GitHub Copilot) | Supported |
| Claude Desktop | Supported |
| Goose | Supported |
For the full list of MCP clients and their Apps support status, see the MCP client matrix.
Try it out
The Incident Command Center is available on the experimental branch. Run the server with write tools enabled to unlock all dashboard actions:
uvx --from git+https://github.com/PagerDuty/pagerduty-mcp-server@experimental pagerduty-mcp --enable-write-tools
Or clone and run locally:
git clone -b experimental https://github.com/PagerDuty/pagerduty-mcp-server.git
cd pagerduty-mcp-server
uv run python -m pagerduty_mcp --enable-write-tools
The Incident Command Center is experimental. It may change or break between commits and is not covered by the standard support policy. Run it in non-production environments.
Feedback
Found a bug? Have a feature idea? Open a GitHub issue tagged experimental:
github.com/PagerDuty/pagerduty-mcp-server/issues
You can also find the FDE team in the community streams — screenshots and live demos of experimental features appear there regularly before they're fully documented.